Code

Coding, Programming & Algorithms, Tips, Tweaks & Hacks
Search

Showing posts with label HTML. Show all posts

Using WebP image format for browsers that support it : Part 2

Almost a decade ago, I wrote about Using WebP image format for browsers that support it.
Now there's a different method to implement this, but not using CSS3 - rather, this is purely based on the new <picture> HTML5 tag.
HTML

<picture>
  <source srcset="https://mywebsite.com/images/cat.webp" type="image/webp">
  <img src="https://mywebsite.com/images/cat.png" loading="lazy"/>
</picture>
HTML 5

Safari which doesn't support webp will load cat.png while other browsers will load cat.webp.
If you are wondering what loading="lazy" is, check out https://web.dev/native-lazy-loading/ - currently supported only in Chrome.

Vanakkam !

Commas in HTML INPUT textfields for better readability

Sometimes, when a user enters numbers into a HTML INPUT text field, he/she enters commas too for readability esp in the case of financial inputs.

But when we send the input data via a form to the backend script for storing into a database, say MySQL database, we don't want the commas in the SQL INSERT statement.

So here's a script to show the commas while typing and remove the commas on hitting the submit button.


Vanakkam !

Google Visualization & Google Maps using GeoCoding

Flash & JavaScript examples of using markers & geocoding on Maps.
I've never been a big fan of Flash, given that that's what dominates the web design animation spectrum.
Agreed that you can make things look much cooler very easily using Flash, while achieving the same UI using JavaScript may take 10 times the effort. But this should change over time with the development of HTML5's canvas element.
With Google's Visualization Geomap API you can get the nice map interface that you've seen in Google Analytics.
But the Maps API is lighter and you can move it around & zoom using the mouse.

Google Visualization Geomap API
<!DOCTYPE html>
<html lang="en">
<head>
<meta charset="utf-8" />
<meta http-equiv="Content-Type" content="text/html;charset=utf-8" >
<title>Google Visualization Geomap API</title>
<script type="text/javascript" src="http://www.google.com/jsapi"></script>
<script type="text/javascript">
google.load('visualization', '1', {'packages': ['geomap']});
var population =
[
['Mumbai',13830884],['Delhi',12565901],
['Bangalore',5438065],['Kolkata',5138208],
['Chennai',4616639],['Hyderabad',4068611],
['Ahmedabad',3959432],['Pune',3446330],
['Surat',3344135],['Kanpur',3221435],
['Jaipur',3210570],['Lucknow',2750447],
['Nagpur',2447063],['Patna',1875572],
['Indore',1854930],['Thane',1807616],
['Bhopal',1792203],['Ludhiana',1740247],
['Agra',1686976],['Pimpri Chinchwad',1637905]
];
google.setOnLoadCallback(function()
{
var data = new google.visualization.DataTable();
data.addColumn('string', 'City');
data.addColumn('number', 'Population');
data.addRows(population);
var geomap = new google.visualization.GeoMap(document.getElementById('geomap'));
geomap.draw(data, {width:'500px',height:'500px',region:'IN',dataMode:'markers',showLegend:false});
});
</script>
</head>
<body>
<div id="geomap" style="width:500px;height:500px;"></div>
</body>
</html>
JavaScript

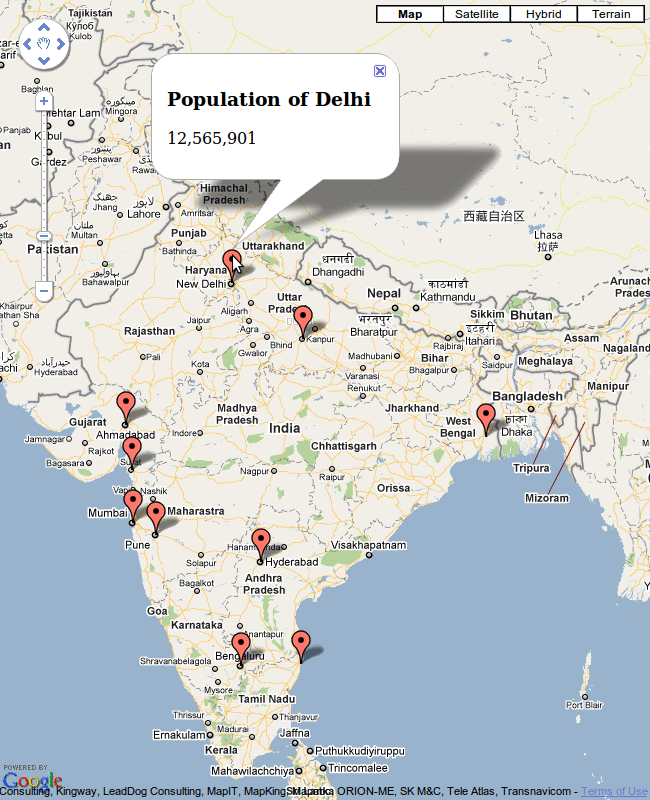
Google Visualization in Browser

Google Maps & Geocoder
<!DOCTYPE html>
<html lang="en">
<head>
<meta charset="utf-8" />
<meta http-equiv="Content-Type" content="text/html;charset=utf-8" >
<title>Google Maps and GeoCoder API</title>
<script type="text/javascript" src="http://www.google.com/jsapi"></script>
<script type="text/javascript">
google.load('maps', '3', {"other_params":"sensor=true"});
var population =
[
['Mumbai','13,830,884'],['Delhi','12,565,901'],
['Bangalore','5,438,065'],['Kolkata','5,138,208'],
['Chennai','4,616,639'],['Hyderabad','4,068,611'],
['Ahmedabad','3,959,432'],['Pune','3,446,330'],
['Surat','3,344,135'],['Kanpur','3,221,435']
];
var map;
google.setOnLoadCallback(function()
{
var point = new google.maps.LatLng(24.046464, 81.342773);
var options =
{
zoom:5,
center:point,
mapTypeId: google.maps.MapTypeId.ROADMAP
};
map = new google.maps.Map(document.getElementById("geomap"), options);
geocoder = new google.maps.Geocoder();
for (var i = 0; i < population.length; i++)
{
geocoder.geocode({'address':population[i][0]}, createMarker(i));
}
});

function createMarker(i)
{
return function(results, status)
{
if (status == google.maps.GeocoderStatus.OK)
{
var infowindow = new google.maps.InfoWindow({ content: "<div><h3>Population of " + population[i][0] + "</h3><p>" + population[i][1] + "</p></div>" });
var marker = new google.maps.Marker(
{
position:results[0].geometry.location,
map:map,
title:population[i][1]
});
google.maps.event.addListener(marker, 'click', function() { infowindow.open(map,marker); });
}
else
{
alert("Geocode was not successful for the following reason: " + status);
}
}
}
</script>
</head>
<body>
<div id="geomap" style="width:650px;height:800px;"></div>
</body>
</html>
JavaScript

Google Maps

Limitations with Visualization API :

  • A maximum of 400 entries (markers)
  • Much slower if the data format is an address instead of a Latitude/Longitude pair
  • If you are targetting India, Maps is the better way to go as the Visualization API has cut off a major portion of the J&K !

Limitations with Google Maps :

  • Geocoder has a limit of 2500 requests per day, and looks about like 10 requests at a time.
  • Need to center the map and adjust zoom level manually to show withing the bounding div. Visualization API does this automatically by specifying region:'IN'

In both cases, storing Latitude/Longitude pairs offline and then geo-locating the same renders a whole lot faster.

Vanakkam !

1 pixel wide line parallel to the axis in HTML's Canvas element

I was playing around with HTML's Canvas element and I spent a whole day trying to figure out why I can't draw a 1-pixel wide straight line (parallel to the axes). If you try dawing a black (#000000) straight line parallel to the axes, then for all odd numbered widths :
  • the first line is of colour #9d9d9d and the last one is of #8d8d8d
  • The width of the line is one pixel more
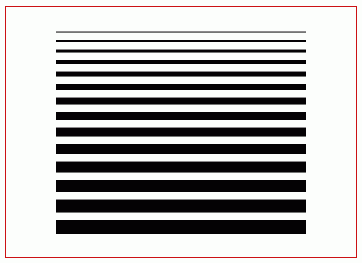
Canvas Lines
<html>
<head>
        <meta http-equiv="Content-Type" content="text/html;charset=iso-8859-1"/>
        <title>HTML5 - Canvas</title>
        <meta http-equiv="Content-Language" content="en-us"/>
        <script type="text/javascript">
        function foo()
        {
            var canvas = document.getElementById("canvas-line");
            var ctx = canvas.getContext('2d');
            
            for (i = 1, j = 0; i < 15; i++, j+=i+7)
            {
                ctx.beginPath();
                ctx.lineWidth = i;
                ctx.strokeStyle = "black";
                ctx.moveTo(50,25 + j);
                ctx.lineTo(300,25 + j);
                ctx.stroke();
            }
        }

        </script>
</head>
<body onload="foo()">
<canvas id="canvas-line" width="350" height="250" style="border:1px solid #cf1313; margin-left:100px;"></canvas>
</body>
</html>
HTML 5 + JavaScript
The above should give an output like this : If you zooom in, you should be able to see the top and bottom border colours. This happens in all canvas-supported browsers (FF 3, FF 3.5 beta 4, Opera 10 beta, Chrome 2 beta, Safari 4 beta). Reason : https://developer.mozilla.org/en/Canvas_tutorial/Applying_styles_and_colors#section_8 Mozilla's canvas tutorial on drawing shapes shows a screenshot which has the inner most rectangle of exactly 1 pixel wide and colour black. But viewing the example itself in the browser, shows otherwise - 2 pixel wide with faded colours. I've written a small function that draws exactly 1 pixel wide straight line parallel to the axis.
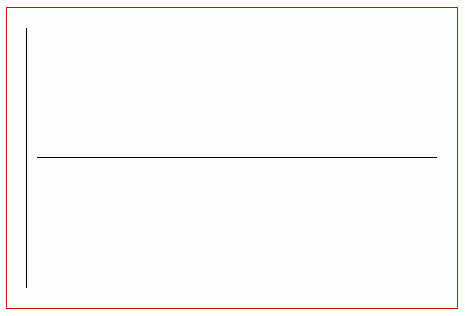
1 pixel wide Canvas line
<html>
<head>
        <meta http-equiv="Content-Type" content="text/html;charset=iso-8859-1"/>
        <title>HTML5 - Canvas</title>
        <meta http-equiv="Content-Language" content="en-us"/>
        <script type="text/javascript">
        /*
        draw1pxLinePA
            Draw a 1 pixel width line parallel to the axis
        Parameters
            x : x coordinate
            y : y coordinate
            l : length
            o : orientation
                0 = horizontal (default)
                1 = vertical
            bg : erase-with colour - for background
        */
        CanvasRenderingContext2D.prototype.draw1pxLinePA = function(x, y, l, o, bg)
        {
            o = o || 0;
            bg = bg || "white";

            this.beginPath();
            this.lineWidth = 2; // 1 creates a 2 pixel wide line with fading
            this.moveTo(x, y);
            this.lineTo(x + (l * !o), y + (l * o));
            this.stroke();

            var strokeStyle = this.strokeStyle; // Save current strokeStyle

            // Erase the extra line
            this.beginPath();
            this.lineWidth = 2;
            this.strokeStyle = bg;
            this.moveTo(x + (1 * o), y + (1 * !o));
            this.lineTo(x + (l * !o) + (1 * o), y + (l * o) + (1 * !o));
            this.stroke();

            this.strokeStyle = strokeStyle; // Restore strokeStyle
        }

        function foo()
        {
            var canvas = document.getElementById("canvas-line");
            var ctx = canvas.getContext('2d');

            ctx.strokeStyle = "black";
            ctx.draw1pxLinePA(20, 20, 260, 1);
            ctx.draw1pxLinePA(30, 150, 400);
        }

        </script>
</head>
<body onload="foo()">

<canvas id="canvas-line" width="450" height="300" style="border:1px solid #cf1313; margin-left:100px;"></canvas>

</body>
</html>
HTML 5 + JavaScript
Vanakkam !

Form submission using AJAX & HTML

One of the biggest concerns using AJAX based form submissions are JavaScript related issues :
  • What if JavaScript is disabled or not available on the client's browser ?
  • What if XMLHttpRequest / Msxml2.XMLHTTP / Microsoft.XMLHTTP aren't available ?
  • What if the creation of XMLHttpRequest object failed for some reason ?
  • What if all the JavaScript scripts didn't load properly and screwed up the damn thing ?
  • What if the user clicked the button much faster than the scripts to completely load ? You must be on a real slow connection for this to happen.
The only solution is to give your users the option to automatically fall back to the normal form submission if AJAX doesn't work. Relying solely on client side scripting should only be done only if the application demands it.
HTML
<form id="Comment-Form" action="http://mydomain.com/PostComment" method="post">
<div id="Comment-Box">
<table>
<tr><th>Leave a Comment</th></tr>
<tr><td id="Comment-Box-Msg" style="display:none"></td></tr>
<tr><td><textarea name="Comment" id="Comment-Reply" rows="10" cols="50"></textarea></td></tr>
<tr><td style="text-align:center">
<input type="submit" value="Post Comment" name="Submit" id="Comment-Button"/>
</td></tr>
</table>
</div>
</form>
HTML 4.01
JavaScript
window.onload = function() { init(); }
function init()
 {
        /* 
        This is set only after the entire page is loaded,
        so if the button is clicked way before its loaded,
        it'll 'normal' submit to the form's action value
        */
        document.getElementById("Comment-Button").onclick = PostCommment;
 }
function PostCommment()
 {
        // AJAX error : switch to <form> submit
        if (ajax_error) document.getElementById("Comment-Form").submit();

        // Do the form submission via AJAX

        // To stop the <form> being submitted, since its done via AJAX
        return false;
 }
Javascript 1.5
This way, it ensures that if there is a problem with JavaScript or AJAX in particular, you can always fall back to the normal form submission.
Vanakkam !